Pipeline analytics
Hiring Pipeline Analytics Guide
How to read pipeline data in a way that helps recruiters fix aging, source quality, panel delays, and offer risk before roles stall.
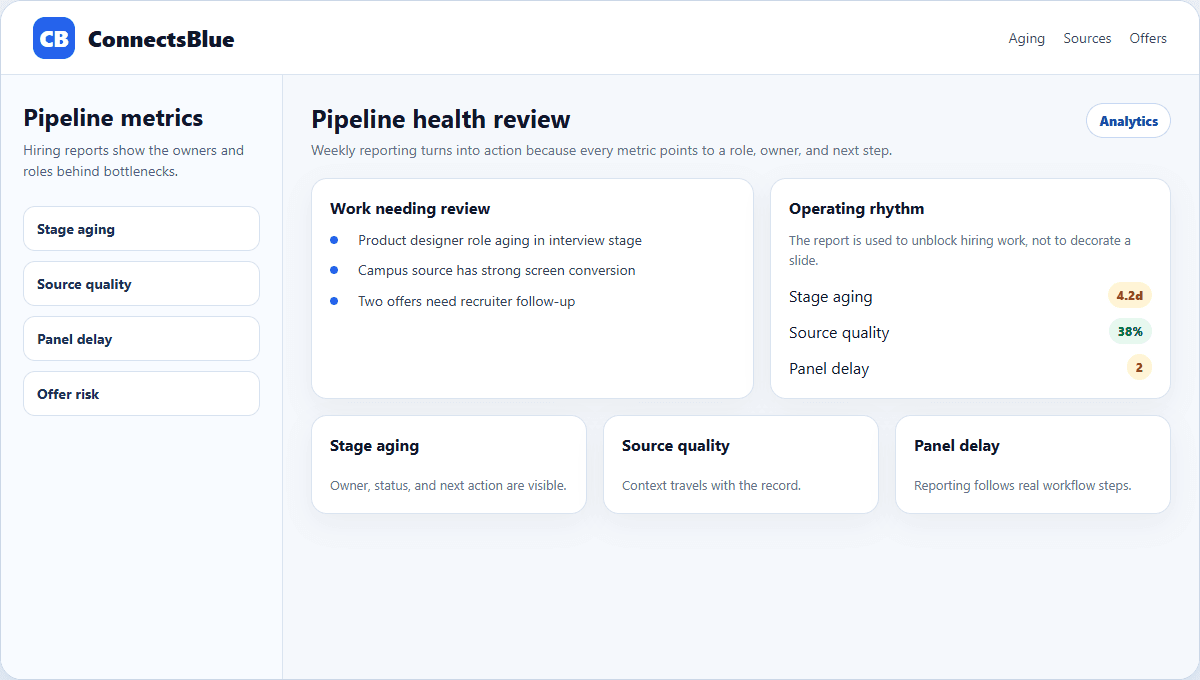
Hiring analytics are only useful when they change what the team does next. A colorful dashboard that nobody trusts is just another meeting slide.
The best pipeline reports stay close to the work: which candidates are waiting, which sources are producing qualified people, which panels are delayed, and where offer risk is starting to appear.
Signal design
Track signals that point to a decision
A pipeline metric should lead to a clear action. If candidate aging is high, someone needs to review stalled profiles. If panel feedback is late, the interviewer owner needs a reminder. If source quality is low, the job distribution plan needs adjustment.
- Track stage aging by role and owner, not only by total average.
- Separate applicant volume from qualified candidate movement.
- Measure panel feedback completion after each interview loop.
- Watch offer acceptance risk before the final approval meeting.
Dashboard hygiene
Keep definitions simple enough for managers to trust
Metric
Stage aging
Definition that works
Days since the candidate entered the current stage.
Common mistake
Averaging all candidates without stage context.
Metric
Source quality
Definition that works
Candidates from a source who reach screen, interview, or offer.
Common mistake
Reporting only raw applications.
Metric
Panel delay
Definition that works
Time from interview completion to submitted feedback.
Common mistake
Counting scheduled interviews as completed evidence.
Metric
Offer risk
Definition that works
Open offers without signed acceptance or follow-up date.
Common mistake
Only reporting final accepted offers.
Operating rhythm
Review pipeline health in short weekly rituals
A weekly pipeline review should be narrow and practical. Start with the roles that are aging, then inspect candidates waiting in the most expensive stages. The conversation should end with owners and deadlines, not a general observation that hiring is slow.
Recruiter action
Move, decline, or follow up with candidates who have waited past the stage threshold.
Manager action
Resolve unclear requirements, delayed feedback, or compensation gaps that block movement.
Source action
Pause low-quality channels and double down on sources producing screen-ready candidates.
Offer action
Confirm approvals, letter status, and candidate communication before momentum drops.
Interpretation
Use analytics to ask better questions, not to blame the team
Pipeline numbers can create defensive conversations if they are treated as performance theater. Use the data to locate friction: unclear job requirements, slow interviewers, weak source mix, duplicate review work, or missing offer ownership.
When the team trusts the definitions, analytics become a coordination tool rather than a surveillance layer.
Implementation notes
How to use this guide in a real hiring workflow
Use this article as a working review document, not just a buying overview. Compare hiring pipeline analytics guide with the way your team currently works, then fix the places where ownership, evidence, or candidate communication is unclear.
- Name the owner for the stage before changing configuration.
- Define the evidence recruiters and managers should capture.
- Review candidate-facing messages for clarity and tone.
- Measure whether the change reduced delay, rework, or ambiguity.
Questions teams ask
Hiring Pipeline Analytics Guide FAQ
What is hiring pipeline analytics?
It is the practice of tracking candidates through each hiring stage to understand speed, source quality, bottlenecks, feedback delays, and offer movement.
Which pipeline metric should teams watch first?
Stage aging is often the best starting point because it points directly to candidates and owners who need action.
How often should hiring teams review pipeline analytics?
Weekly is enough for most teams, with faster reviews for urgent or high-volume roles.
Next step
Make pipeline health visible before roles stall.
Use ConnectsBlue to track stage aging, feedback gaps, source quality, and offer follow-up from the same recruiting workspace.
View employer tools